Sparklines in Excel은 누구나 알고 있을 것을 가정함.
with Google Sheets
- Lists tab: chatGPT를 이용해서 symbol (ticker), market_cap, sector 를 채웠다 (따라서 market_cap value는 틀릴 가능성 매우 높음)
- Hitec tab: googlefinance 함수를 이용해서 data를 불러오고, sparkline, chart+trend line을 그렸음.
with Seaborn and Pandas (ipynb)
- Data: Changing Sectors, Changing Correlations (2022, MSCI)
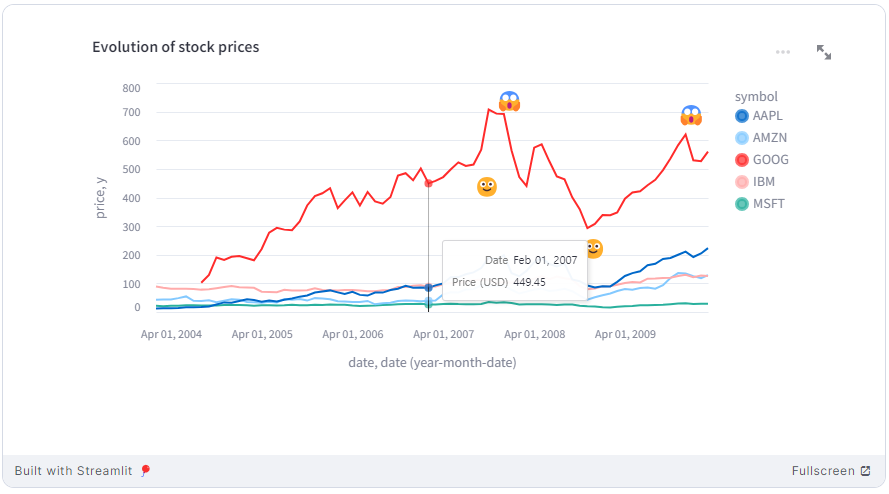
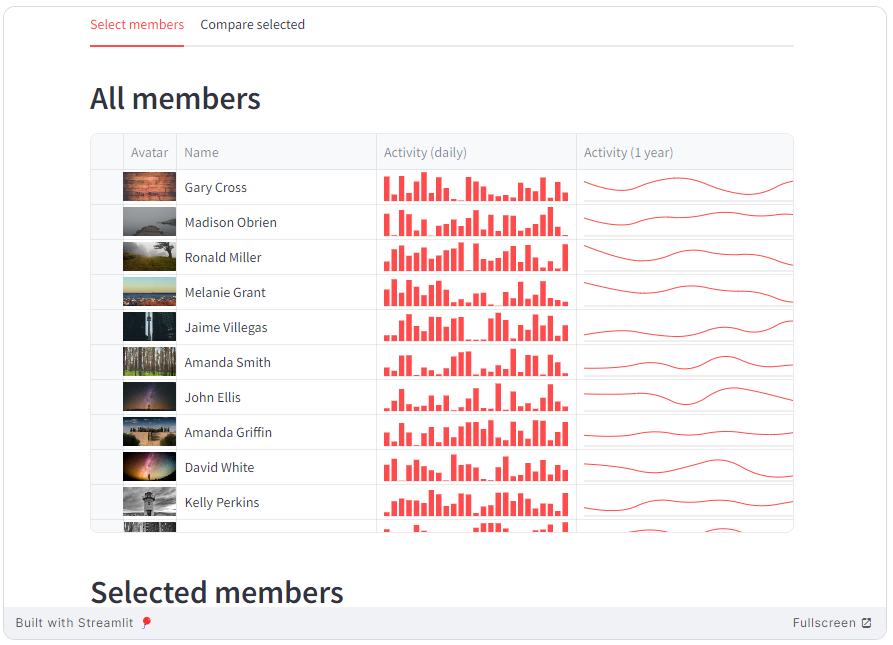
with Streamlit (py)
Build Streamlit apps in your browser with GitHub Codespaces 클라우드 편집 및 배포 환경 이해: Browser에서 GitHub Codespaces를 활용해 Streamlit App (Python 기반 웹 앱 프레임워크)을 직접 코딩하고 실행하는 방법.
https://primenumbersam-altair.streamlit.app/