Gemini CLI를 사용하여
https://roy-jung.github.io/250701-history-of-js/ 내용을
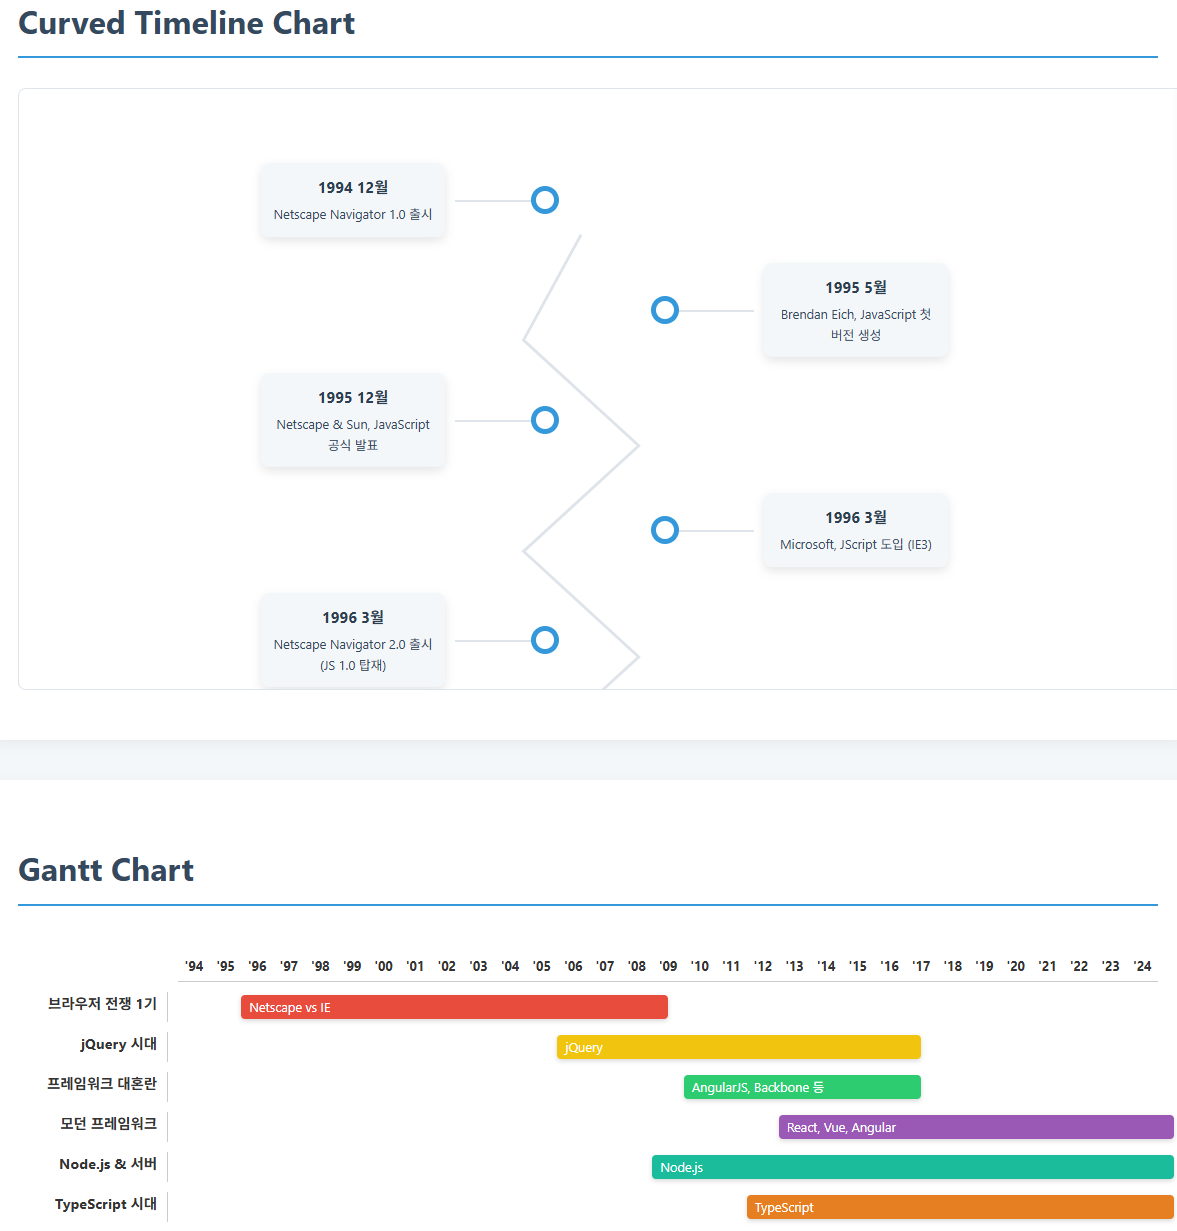
다음 2가지 방식의 Infographics (Timeline Visualization)로 표현한 index.html을 만들어 봤다.
- Curved (Zigzag) Timeline Chart
- Gantt Chart
그런데, Curved Timeline Chart가 이상하다.
Gemini CLI를 사용하여
https://roy-jung.github.io/250701-history-of-js/ 내용을
다음 2가지 방식의 Infographics (Timeline Visualization)로 표현한 index.html을 만들어 봤다.
그런데, Curved Timeline Chart가 이상하다.